Documentation Index
Fetch the complete documentation index at: https://trigger-docs-mcp-readonly-runtime-flag.mintlify.app/llms.txt
Use this file to discover all available pages before exploring further.
Available tables
runs: contains all task run data including status, timing, costs, and task output. Run metadata (key-value set in your task) is not available on the Query page.
metrics: contains metrics data for your runs including CPU, memory, and your custom metrics
llm_metrics: contains LLM/AI metrics including token usage, costs, latency, and model performance data from GenAI spans
metrics table columns
| Column | Type | Description |
|---|
metric_name | string | Metric identifier (e.g., process.cpu.utilization) |
metric_type | string | gauge, sum, or histogram |
metric_value | number | The observed value |
bucket_start | datetime | 10-second aggregation bucket start time |
run_id | string | Associated run ID |
task_identifier | string | Task slug |
attempt_number | number | Attempt number |
machine_id | string | Machine that produced the metric |
machine_name | string | Machine preset (e.g., small-1x) |
worker_version | string | Worker version |
environment_type | string | PRODUCTION, STAGING, DEVELOPMENT, PREVIEW |
attributes | json | Raw JSON attributes for custom data |
See Logging, tracing & metrics for the full list of automatically collected metrics and how to create custom metrics. You can visualize this data on Dashboards.
Use prettyFormat() to format metric values for display:
SELECT
timeBucket(),
prettyFormat(avg(metric_value), 'bytes') AS avg_memory_usage
FROM metrics
WHERE metric_name = 'process.memory.usage'
GROUP BY timeBucket
ORDER BY timeBucket
LIMIT 1000
Available format types: bytes, percent, duration, durationSeconds, quantity, costInDollars.
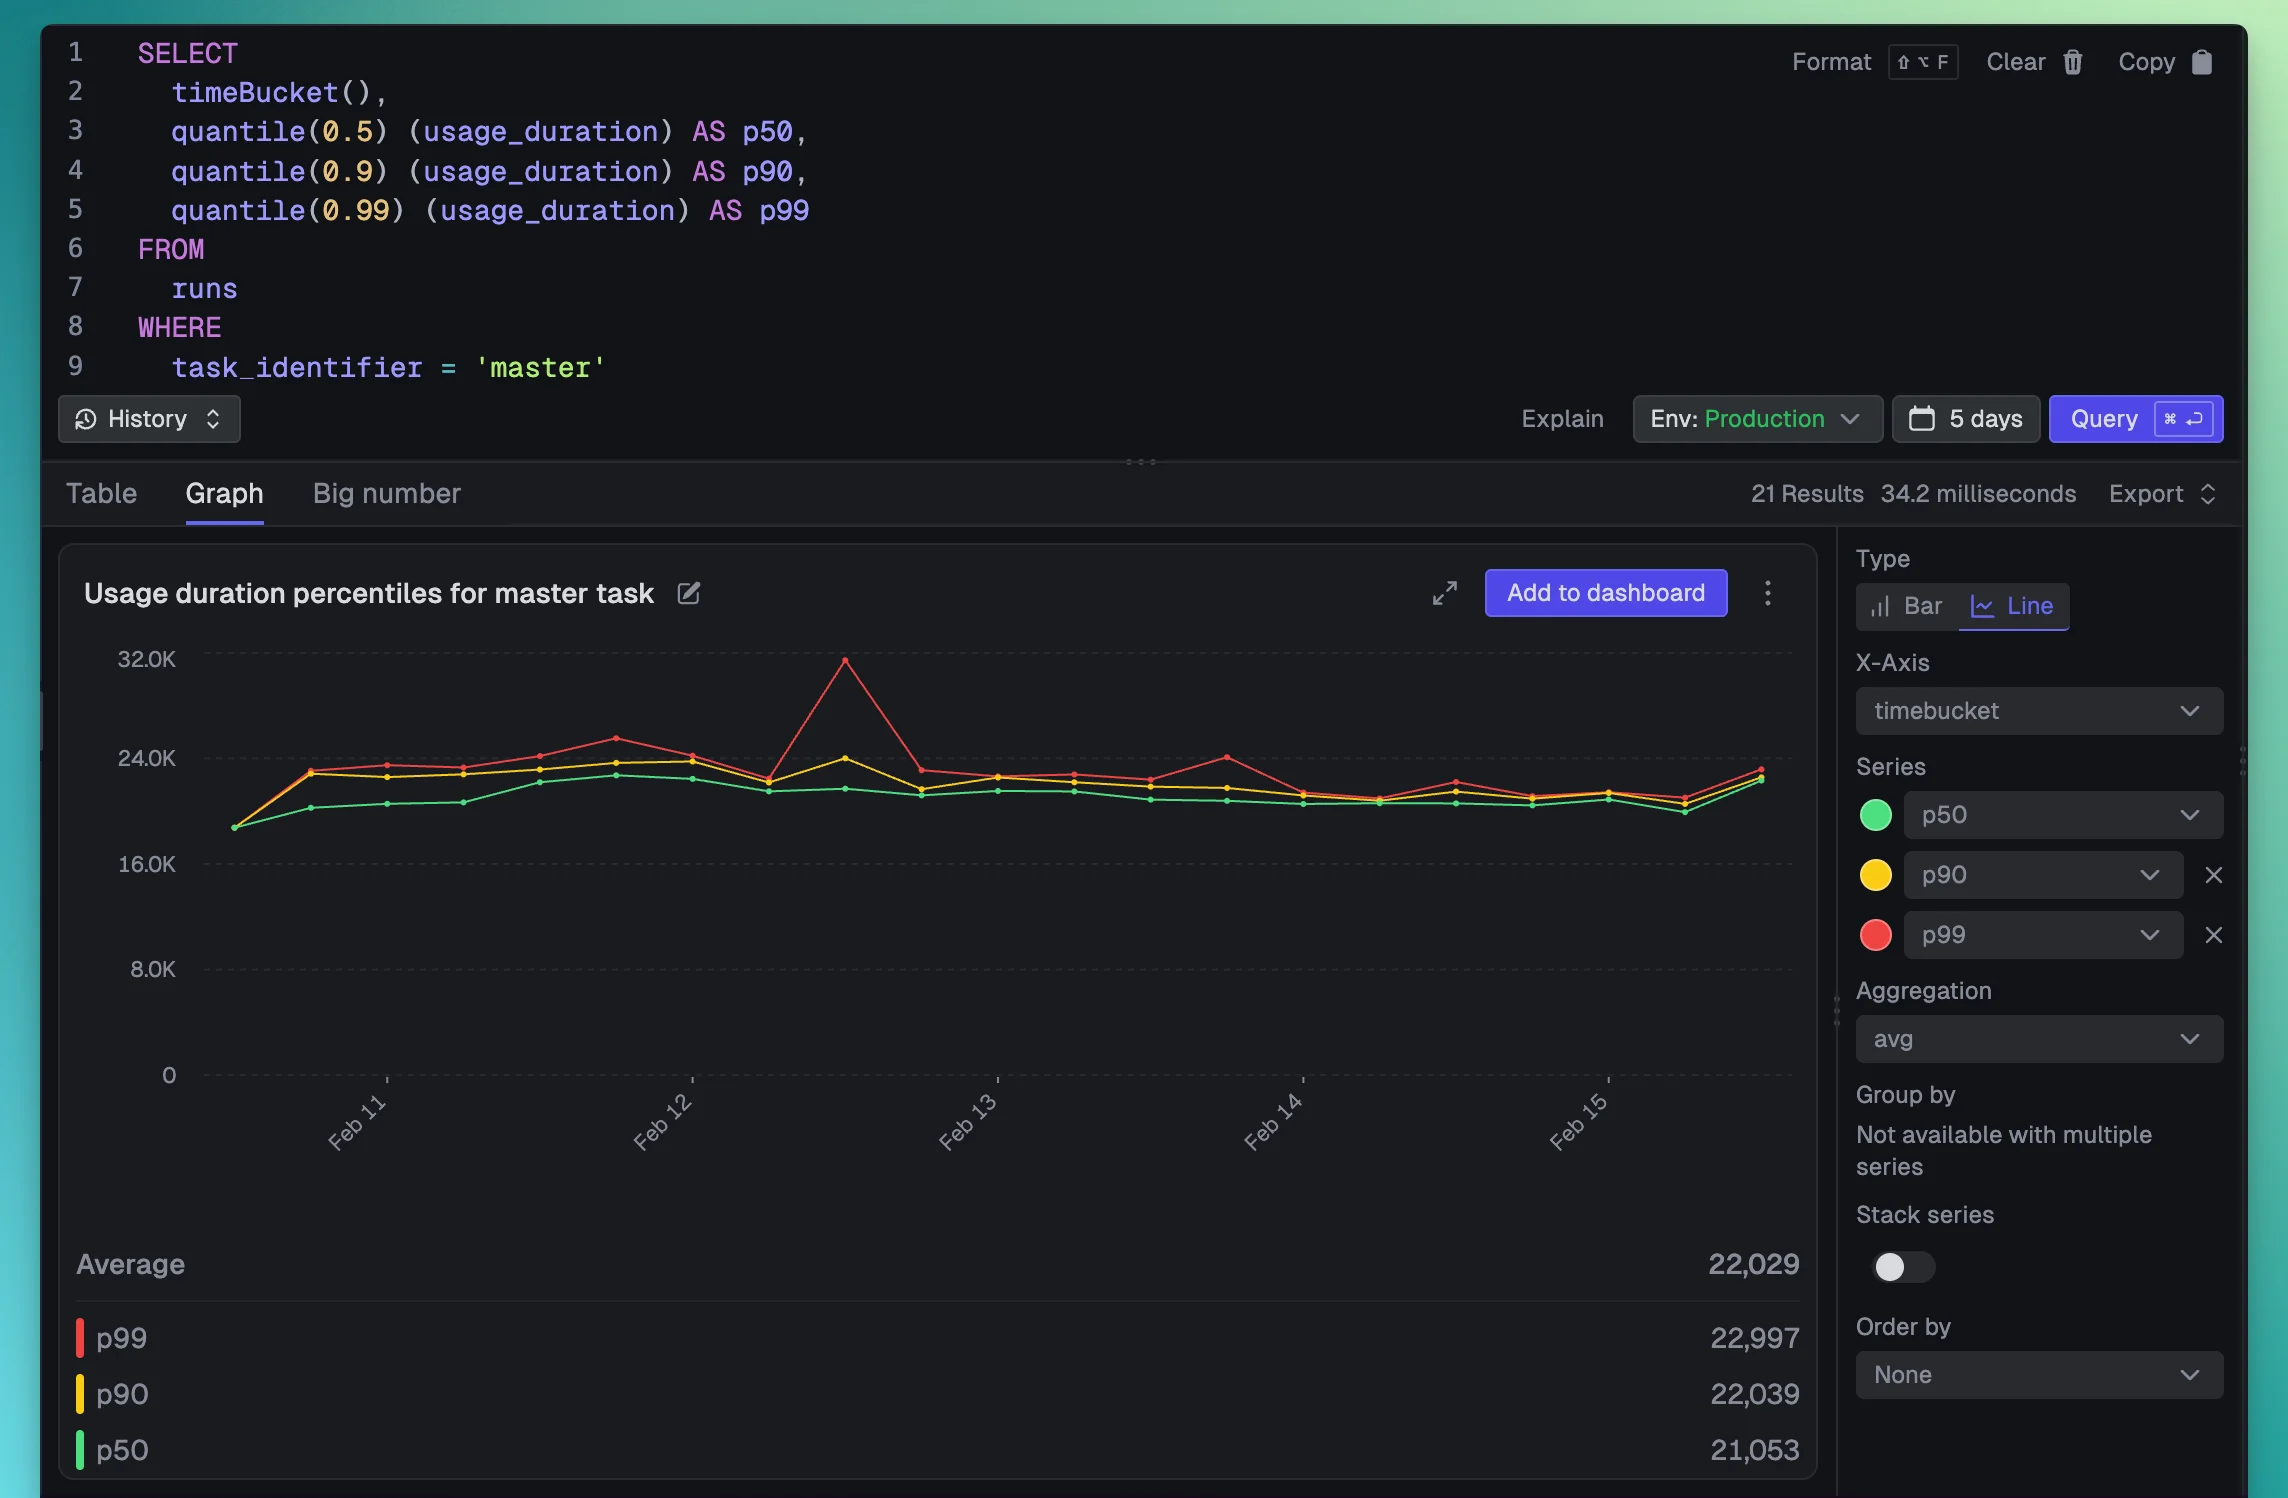
Using the Query dashboard
Navigate to the Query page to write and execute queries. The dashboard provides:
- AI-powered query generation - Describe what you want in natural language
- Syntax highlighting - SQL syntax highlighting for better readability
- Query history - Access your previous queries
- Interactive help - Built-in documentation for TRQL syntax and functions
- Export options - Download results as JSON or CSV
Querying from the SDK
Use query.execute() to run TRQL queries programmatically from your backend code:
import { query } from "@trigger.dev/sdk";
// Basic query with defaults (environment scope, json format)
const result = await query.execute("SELECT run_id, status FROM runs LIMIT 10");
console.log(result.results); // Array<Record<string, any>>
Type-safe queries
Use the QueryTable type for nice inferred types in your query results:
import { query, type QueryTable } from "@trigger.dev/sdk";
// Type-safe query using QueryTable with specific columns
const typedResult = await query.execute<QueryTable<"runs", "run_id" | "status" | "triggered_at">>(
"SELECT run_id, status, triggered_at FROM runs LIMIT 10"
);
typedResult.results.forEach((row) => {
console.log(row.run_id, row.status); // Fully typed!
});
Query options
import { query } from "@trigger.dev/sdk";
const result = await query.execute("SELECT COUNT(*) as count FROM runs", {
// Scope: "environment" (default), "project", or "organization"
scope: "project",
// Time period using shorthand (e.g., "7d", "30d", "1h")
period: "7d",
// Or use explicit time range
// from: new Date("2024-01-01"),
// to: new Date("2024-01-31"),
// Response format: "json" (default) or "csv"
format: "json",
});
CSV export
Export query results as CSV by setting format: "csv":
const csvResult = await query.execute("SELECT run_id, status, triggered_at FROM runs", {
format: "csv",
period: "7d",
});
const lines = csvResult.results.split("\n");
console.log(lines[0]); // CSV header row
Querying from the REST API
Execute queries via HTTP POST to /api/v1/query:
curl -X POST https://api.trigger.dev/api/v1/query \
-H "Authorization: Bearer YOUR_SECRET_KEY" \
-H "Content-Type: application/json" \
-d '{
"query": "SELECT run_id, status FROM runs LIMIT 10",
"scope": "environment",
"period": "7d",
"format": "json"
}'
See the API reference for full details.
TRQL syntax guide
Basic queries
Select columns from a table:
SELECT run_id, task_identifier, status
FROM runs
LIMIT 10
Alias columns with AS:
SELECT task_identifier AS task, count() AS total
FROM runs
GROUP BY task
Using *
Note that when you use SELECT * we don’t return all the columns, we only return the core columns. This is for performance reasons (the underlying ClickHouse database is columnar and selecting lots of columns isn’t efficient).
You should specify the columns you want to return.
Filtering with WHERE
Use comparison operators:
SELECT run_id, task_identifier FROM runs
WHERE status = 'Failed'
Available operators:
-- Comparison operators
WHERE status = 'Failed' -- Equal
WHERE status != 'Completed' -- Not equal
WHERE attempt_count > 3 -- Greater than
WHERE attempt_count >= 3 -- Greater than or equal
WHERE attempt_count < 5 -- Less than
WHERE attempt_count <= 5 -- Less than or equal
-- IN for multiple values
WHERE status IN ('Failed', 'Crashed')
-- LIKE for pattern matching (% = wildcard)
WHERE task_identifier LIKE 'email%'
-- ILIKE for case-insensitive matching
WHERE task_identifier ILIKE '%send%'
-- BETWEEN for ranges
WHERE triggered_at BETWEEN '2024-01-01' AND '2024-01-31'
-- NULL checks
WHERE completed_at IS NOT NULL
WHERE completed_at IS NULL
-- Array column checks
WHERE has(tags, 'user_12345')
WHERE notEmpty(tags)
WHERE hasAny(tags, array('user_12345', 'user_67890'))
WHERE hasAll(tags, array('user_12345', 'user_67890'))
WHERE indexOf(tags, 'user_12345') > 0
WHERE arrayElement(tags, 1) = 'user_12345'
Sorting and limiting
Sort results with ORDER BY:
SELECT run_id, compute_cost, triggered_at
FROM runs
ORDER BY compute_cost DESC, triggered_at ASC
LIMIT 50
Grouping and aggregation
Use GROUP BY with aggregate functions:
SELECT
task_identifier,
avg(metric_value) AS avg_memory
FROM metrics
WHERE metric_name = 'process.memory.usage'
GROUP BY task_identifier
ORDER BY avg_memory DESC
LIMIT 20
Available functions
TRQL provides a rich set of functions for data analysis.
Aggregate functions
count() - Count rows
countIf(col, cond) - Count rows matching condition
countDistinct(col) - Count unique values
sum(col) - Sum of values
sumIf(col, cond) - Sum values matching condition
avg(col) - Average of values
min(col) - Minimum value
max(col) - Maximum value
median(col) - Median value (50th percentile)
quantile(p)(col) - Value at percentile p (0-1)
stddevPop(col) - Population standard deviation
stddevSamp(col) - Sample standard deviation
Example:
SELECT
task_identifier,
count() AS total_runs,
avg(usage_duration) AS avg_duration_ms,
median(usage_duration) AS median_duration_ms,
quantile(0.95)(usage_duration) AS p95_duration_ms
FROM runs
GROUP BY task_identifier
Date/time functions
Time bucketing:
-- Auto-bucket by time period based on query's time range
SELECT timeBucket(), count() AS runs
FROM runs
GROUP BY timeBucket()
Date extraction:
SELECT
toYear(triggered_at) AS year,
toMonth(triggered_at) AS month,
toDayOfWeek(triggered_at) AS day_of_week,
toHour(triggered_at) AS hour
FROM runs
Date truncation:
SELECT
toStartOfDay(triggered_at) AS day,
count() AS runs_per_day
FROM runs
GROUP BY day
ORDER BY day DESC
Date arithmetic:
-- Add/subtract time
SELECT dateAdd('day', 7, triggered_at) AS week_later
FROM runs
-- Calculate differences
SELECT dateDiff('minute', executed_at, completed_at) AS duration_minutes
FROM runs
WHERE completed_at IS NOT NULL
Common date functions:
now() - Current date and time
today() - Current date
toDate(dt) - Convert to date
toStartOfDay(dt), toStartOfHour(dt), toStartOfMonth(dt) - Truncate to start of period
formatDateTime(dt, format) - Format datetime as string
String functions
SELECT
lower(status) AS status_lower,
upper(status) AS status_upper,
concat(task_identifier, '-', status) AS combined,
substring(run_id, 1, 8) AS short_id,
length(task_identifier) AS name_length
FROM runs
Common string functions:
length(s) - String length
lower(s), upper(s) - Case conversion
concat(s1, s2, ...) - Concatenate strings
substring(s, offset, len) - Extract substring
trim(s) - Remove whitespace
replace(s, from, to) - Replace occurrences
startsWith(s, prefix), endsWith(s, suffix) - Check prefixes/suffixes
Conditional functions
SELECT
run_id,
if(status = 'Failed', 1, 0) AS is_failed,
multiIf(
status = 'Completed', 'ok',
status = 'Failed', 'bad',
'other'
) AS status_category,
coalesce(completed_at, triggered_at) AS end_time
FROM runs
if(cond, then, else) - Conditional expression
multiIf(c1, t1, c2, t2, ..., else) - Multiple conditions (like CASE)
coalesce(a, b, ...) - First non-null value
Math functions
SELECT
round(compute_cost, 4) AS cost_rounded,
ceil(usage_duration / 1000) AS duration_seconds_up,
floor(usage_duration / 1000) AS duration_seconds_down,
abs(compute_cost) AS cost_abs
FROM runs
Array functions
Useful for working with tags and other array columns:
SELECT
run_id,
tags,
length(tags) AS tag_count,
has(tags, 'user_12345') AS is_production,
arrayJoin(tags) AS individual_tag -- Expand array to rows
FROM runs
WHERE notEmpty(tags)
JSON functions
The output, error, and metrics.attributes columns are already JSON, so use dot notation to read or filter on them. You don’t need JSONExtract* for these (those are for string columns).
SELECT
run_id,
output.message AS output_message,
output.count AS count,
output.externalId AS external_id
FROM runs
WHERE task_identifier = 'my-task'
AND output.externalId = 'something'
ORDER BY triggered_at DESC
LIMIT 100
Query scopes
Control what data your query can access:
environment (default) - Query runs in the current environment only
project - Query runs across all environments in the project
organization - Query runs across all projects in the organization
// Query across all environments in a project
const result = await query.execute("SELECT environment, count() FROM runs GROUP BY environment", {
scope: "project",
});
Time ranges
We recommend avoiding adding triggered_at in the actual TRQL query. The dashboard, API, and SDK have a time filter that is applied automatically and is easier to work with. It means the queries can be executed with multiple periods easily.
Using period shorthand
await query.execute("SELECT count() FROM runs", {
period: "4d", // Last 4 days
});
// Supported periods: "1h", "6h", "12h", "1d", "7d", "30d", "90d", etc.
Using explicit dates
await query.execute("SELECT count() FROM runs", {
from: new Date("2024-01-01"),
to: new Date("2024-01-31"),
});
// Or use Unix timestamps
await query.execute("SELECT count() FROM runs", {
from: Date.now() - 7 * 24 * 60 * 60 * 1000, // 7 days ago
to: Date.now(),
});
Example queries
Failed runs (in the last 24 hours)
SELECT
task_identifier,
run_id,
error,
triggered_at
FROM runs
WHERE status = 'Failed'
ORDER BY triggered_at DESC
With the time filter set to 24h.
Task success rate by day
SELECT
toDate(triggered_at) AS day,
task_identifier,
countIf(status = 'Completed') AS completed,
countIf(status = 'Failed') AS failed,
round(completed / (completed + failed) * 100, 2) AS success_rate_pct
FROM runs
WHERE status IN ('Completed', 'Failed')
GROUP BY day, task_identifier
ORDER BY day DESC, task_identifier
Top 10 most expensive runs
SELECT
run_id,
task_identifier,
compute_cost,
usage_duration,
triggered_at
FROM runs
WHERE compute_cost > 0
ORDER BY compute_cost DESC
LIMIT 10
Average compute duration over time
SELECT
timeBucket() AS time,
task_identifier,
avg(usage_duration) AS avg_duration_ms,
count() AS run_count
FROM runs
WHERE usage_duration IS NOT NULL
GROUP BY time, task_identifier
ORDER BY time ASC
Runs by queue and machine
SELECT
queue,
machine,
count() AS run_count,
countIf(status = 'Completed') AS completed,
countIf(status = 'Failed') AS failed
FROM runs
GROUP BY queue, machine
ORDER BY queue, machine
CPU utilization over time
Track process CPU utilization bucketed over time.
SELECT
timeBucket(),
avg(metric_value) AS avg_cpu
FROM metrics
WHERE metric_name = 'process.cpu.utilization'
GROUP BY timeBucket
ORDER BY timeBucket
LIMIT 1000
Memory usage by task (past 7d)
Average process memory usage per task identifier over the last 7 days.
SELECT
task_identifier,
avg(metric_value) AS avg_memory
FROM metrics
WHERE metric_name = 'process.memory.usage'
GROUP BY task_identifier
ORDER BY avg_memory DESC
LIMIT 20
Available metric names
List all distinct metric names collected in your environment.
SELECT
metric_name,
count() AS sample_count
FROM metrics
GROUP BY metric_name
ORDER BY sample_count DESC
LIMIT 100
Best practices
- Use the built-in time filtering - The dashboard, API, and SDK have a time filter that is applied automatically and is easier to work with. It means the queries can be executed with multiple periods easily.
- Use LIMIT - Add a
LIMIT clause to reduce the rows returned if you don’t need everything.
- Use appropriate aggregations - For large datasets, use
uniq() instead of uniqExact() for approximate but faster counts
Limits
We have several limits to prevent abuse and ensure performance:
- Concurrency limit: We limit the number of concurrent queries per organization.
- Row limit: We limit the number of rows returned to 10k.
- Time restrictions: We limit the time period you can query.
- Time/Memory limit: We limit the memory a query can use and the time it can run for. As well as other limits like AST complexity.
See Limits for current quota details.